

ActiveMQ windows performance counters
Introduction
At Practice Fusion, we’ve been using ActiveMQ as our messaging solution for the last couple years. It’s a great open source option for distributed messaging that’s reliable and scalable (when configured correctly). However, one important feature that doesn’t seem to be included is the ability to track queue metrics over time. I wanted to see queue depth, enqueue rate, and dequeue rate as they fluctuate throughout the day and week. This is useful in a number of areas, including:
- Understanding the usage and behavior of the system
- Performance tuning
- Capacity planning and scaling
- System monitoring and alerts
- Calculating queue recovery time after planned outages
AMQ offers an admin screen with basic queue information, including queue depth and total number of messages enqueued and dequeued. What’s missing is the ability to track changes in these numbers over time.
I wrote a simple Windows service to poll AMQ and publish queue metrics as performance counters. This in turn can feed into any number of reporting tools, as well as simply providing straightforward, immediate insight via PerfMon.
Metrics
Queue depth
This is perhaps the simplest queue metric there is: how many pending messages are in the queue? We can set alerts to trigger when queue depth gets too high. This can occur when there is a planned or unplanned outage in a downstream service but the upstream service is still running and publishing messages. It can also occur if there is an application defect in the downstream service that impacts its ability to process messages. It’s important to know when queue depth gets too high because if the size of a queue exceeds the configured storage capacity of the broker, it can cause an outage and data loss, which will impact all applications using that broker (not just the ones utilizing the queue in question).
Change in queue depth can be an important data point as well. If queue depth is steadily increasing, it means more messages are being published than are being processed, which could indicate that the downstream component is having a problem or needs to be scaled out. If queue depth is steadily decreasing, it means the downstream component is catching up.
In the case of high queue depth, how do we know what number of messages is too high? For service A, which processes messages very quickly, a queue depth of 50,000 may be perfectly normal. For service B however, which processes messages much more slowly, a queue depth of 20 may signal a problem. How can we easily distinguish between these two states?
In the case of changing queue depth, is there a way to predict how long it will take the system to fully catch up? Is there a way to measure the queue latency (the amount of time a message waits in the queue before being processed)?
The answer to the above questions lies in enqueue rate and dequeue rate.
Enqueue rate
Enqueue rate is the rate at which messages are being added to the queue. AMQ provides an overall enqueue count via its administration page, but the more valuable piece of information I’m trying to get at is the rate at which the enqueue count is growing. This can be measured as an instantaneous rate in terms of messages per minute by periodically polling the administrative interface and calculating the change in enqueue count across the polling interval time span.
What does this metric tell us? A positive enqueue rate indicates that the upstream system is publishing messages. By looking at the average and maximum enqueue rates over a day, we get a sense of how active the upstream system is, or how much demand it is feeding into the pipeline. We can use this information to understand usage, determine performance and scaling needs, and track typical and burst usage over time.
Dequeue rate
Dequeue rate is the rate at which messages are being removed from the queue. Just as with enqueue rate, by tracking the dequeue count from the AMQ administration page we can calculate an instantaneous rate of messages being dequeued per minute.
In a healthy system, the dequeue rate should equal the enqueue rate at all times. This means that the downstream system is processing messages at the same rate that the upstream system is publishing them. There is no queue backup.
Sometimes however, dequeue rate may not be equal to enqueue rate. When dequeue rate is less than enqueue rate, it means the downstream system is lagging. This will be coupled with an increase in queue depth. Some amount of lag in a downstream system can be normal as long as queue depth does not progressively increase to an unsafe level.
If the downstream system is offline, dequeue rate will be zero. This can be used to trigger alerts for unplanned outages. If the downstream system is brought back online after an outage, dequeue rate can be used to help estimate the time to catch up. In this case if the dequeue rate is less than the enqueue rate, it means the downstream system will not catch up without intervention. If the dequeue rate is greater than the enqueue rate, you can estimate the remaining catchup time using a simple calculation.
This leads us to the concept of computed metrics , which explores these use cases in more detail.
Catchup time (computed metric)
Catchup time is an important metric to have in hand when dealing with queue backup scenarios. Whether there is an unexpected increase in load or the system is being brought online after an outage, you may be faced with a nonzero queue depth and wondering how long it will take for the system to fully catch up.
To estimate catchup time, you must subtract enqueue rate from dequeue rate to determine the net depletion rate. If that value is negative, the queue is actually growing in size and you will need to scale out the downstream system or take the upstream system offline to achieve a positive net depletion rate. Once you have a positive net depletion rate, you can divide the queue depth by it to determine the time to catch up.
Example:
Current queue depth is 10,000 messages. Enqueue rate is 1,000 messages per minute and dequeue rate is 1,500 messages per minute. Estimated catchup time is 10000/(1500 - 1000) = 20 minutes.
Latency (computed metric)
Latency tells you how long it takes for a message to be received from the time it is published. This is a function of how long it takes to process all the messages ahead of it in the queue and can help shed light on other metrics. For example, a high queue depth may not indicate a problem if the queue latency is acceptably small. Conversely, when queue depth is low there may still be cause for concern if queue latency is high. High latency values can warrant scaling out the downstream system to ensure that messages get processed in a timely fashion. This can also be an indicator of an application defect or other problem in the downstream system.
To estimate latency, you divide the current queue depth by the dequeue rate. This tells you approximately how long it will take for a message added to the queue now to be picked up by the downstream system, assuming the state of the system does not change. (Note that it does not say anything about the actual time spent for messages already in the queue, as queue depth and dequeue rate can change over time.)
Example:
Current queue depth is 1,000 messages. Dequeue rate is 100 messages per minute. Estimated latency is 1000/100 = 10 minutes. This means there is a 10 minute delay between the time that a message is added to the queue and when it is finally picked up.
How the code works
Libraries Used
No proof of concept would be complete without the use of a healthy number of open source libraries. This project uses the following packages, available via NuGet:
- log4net for no frills, turn-key, configurable logging, essential for any Windows service since no user interface is available to communicate status and errors.
- TopShelf to enable simple Windows service installation and debugging without the need for InstallUtil or MSI bundling.
- TopShelf.Log4Net , an extension for TopShelf that redirects TopShelf log events to configured log4net appenders.
- PerformanceCounterHelper for simple performance counter installation and publication. This eliminates the pain of working directly with performance counters.
- HttpClient for easy REST request semantics. This library is a no-brainer for any project that performs HTTP requests, whether simple or complex.
Polling AMQ
Of course, the project’s nucleus is the part that actually calls the ActiveMQ REST API to retrieve queue information. Browsing to https://broker:8161/admin/queues.jsp will display a human-readable web page with a list of queues and their statistics. There is a corresponding machine-readable REST API endpoint at https://broker:8161/admin/xml/queues.jsp. Both the web page and the REST endpoint require Basic authentication. (The details of how Basic authentication works are outside the scope of this article, though I will show how to do it in C#.) The default credentials are username “admin,” password “admin”.
Here is an example REST call (response body is formatted and abbreviated for clarity):
GET https://localhost:8161/admin/xml/queues.jsp HTTP/1.1
Host: localhost:8161
Authorization: Basic YWRtaW46YWRtaW4=

HTTP/1.1 200 OK
Set-Cookie: JSESSIONID=19q8z1n06owhvqphlv06ind1;Path=/admin
Expires: Thu, 01 Jan 1970 00:00:00 GMT
Content-Type: text/xml;charset=ISO-8859-1
Content-Length: 748
Server: Jetty(7.6.7.v20120910)

<admin>
  <queues>
    <queue name="Queue1">
      <stats size="123" consumerCount="1" enqueueCount="5000" dequeueCount="4877"/>
      <feed>
        <atom>queueBrowse/Queue1?view=rss&feedType=atom_1.0</atom>
        <rss>queueBrowse/Queue1?view=rss&feedType=rss_2.0</rss>
      </feed>
    </queue>
    <queue name="Queue2">
      ...
    </queue>
    ...
  </queues>
</admin>
The C# code to do this looks like this:
private static XDocument GetAdminXml(string queueAdminUrl)
{
  using (var handler = new HttpClientHandler())
  using (var httpClient = new HttpClient(handler))
  {
    // Default credentials for AMQ are admin/admin.
    handler.Credentials = new NetworkCredential("admin", "admin");
    using (var stream = httpClient.GetStreamAsync(queueAdminUrl).Result)
    {
      return XDocument.Load(stream);
    }
  }
}
Publishing performance counter values
Now that we have the queue statistics, it’s time to publish them as performance counter values.
I’ve defined the following counters:
- Queue depth , a NumberOfItems32 counter, is the current number of pending messages in the queue.
- Enqueued per min , an AverageCount64 counter, is the rate of messages being added to the queue per minute. This counter is the numerator of the fraction that defines the rate. It is coupled with an implied AverageBase counter that is the denominator.
- Dequeued per min , an AverageCount64 counter, is the rate of messages being removed from the queue per minute. This is also coupled with an implied AverageBase counter.
PerformanceCounterHelper makes working with performance counters really easy. We simply define them using an attributed enumeration type, and set the raw value, like so:
[PerformanceCounterCategory("AmqMonitor",
  PerformanceCounterCategoryType.MultiInstance,
  "Provides counters to monitor queue statistics in ActiveMQ.")]
public enum PerfCounters
{
  [PerformanceCounter("Queue depth",
    "The current number of pending messages in the queue.",
    PerformanceCounterType.NumberOfItems32)]
  QueueDepth,

  [PerformanceCounter("Enqueued per min",
    "The rate of messages being added to the queue.",
    PerformanceCounterType.AverageCount64)]
  EnqueuedPerMin,

  [PerformanceCounter("Dequeued per min",
    "The rate of messages being removed from the queue.",
    PerformanceCounterType.AverageCount64)]
  DequeuedPerMin,
}

...

if (queueStats.Depth.HasValue)
{
  counterHelper.RawValue(PerfCounters.QueueDepth, queueStats.Depth.Value);
}
As you can see, publishing a simple value like queue depth is straightforward. The per-minute counters require more explanation.
Implementing per minute counters
We’ve all seen “per second” performance counters, but how does one create a “per minute” counter?
There is a performance counter type called RateOfCountsPerSecond64, but it is meant to measure the average count of an operation per second. There is CountPerTimeInterval64, but it measures the count of an operation per tick. In the queuing world, message rates are typically too low for a per second rate (or certainly a per tick rate) to be very useful; a per minute rate is much more appropriate. For this reason, I chose to use AverageCount64 instead, which is normally used to count the average number of items per operation.
In this case, the “operation” (denominator) is a minute, and the count of things (numerator) is the number of messages enqueued in that minute. PerfMon determines the rate by taking two samples of the fraction counter (numerator) and its corresponding base counter (denominator) and then calculates the difference in the numerator values divided by the difference in the denominator values. Change in message count (N1 - N0) divided by change in minutes (D1 - D0) equals messages per minute.
At this point, we need to discuss precision. Although the rate is expressed in messages per minute, we don’t want to publish a base counter value (denominator) in terms of minutes. This would cause two types of quantization error: the rate could be either over- or under-reported, depending on whether two samples occupy the same clock minute or span clock minutes, respectively. This effect occurs because the denominator would be the nearest whole clock minute rather than the smaller or larger span of time that actually elapsed between the two samples.
To avoid these quantization errors, we publish the rate using second-accuracy. To do this we actually make the denominator in seconds, and we scale up the numerator to keep the calculated rate in messages per minute. Messages times 60 seconds per minute, divided by seconds equals messages per minute.
Here’s what it looks like in code:
if (queueStats.Enqueued.HasValue)
{
  counterHelper.RawValue(PerfCounters.EnqueuedPerMin, queueStats.Enqueued.Value * secondsPerMinute);
  counterHelper.BaseRawValue(PerfCounters.EnqueuedPerMin, queueStats.TimestampInSeconds);
}
Wiring it all up
Fortunately, TopShelf makes it super easy to get this service up and running. The code to run the service (which incidentally is also the code that performs service installation) is this:
HostFactory.Run(h =>
{
  h.Service(s =>
  {
    s.ConstructUsing(() => new AmqMonitorService());
    s.WhenStarted(service => service.Start());
    s.WhenStopped(service => service.Stop());
  });
  h.AfterInstall(() => PerformanceHelper.Install(typeof(PerfCounters)));
  h.AfterUninstall(() => PerformanceHelper.Uninstall(typeof(PerfCounters)));
  h.RunAsLocalService();
  h.SetServiceName("AmqMonitor");
  h.SetDescription("Monitor service that publishes AMQ queue statistics as performance counters.");
  h.UseLog4Net();
});
This also allows you to run the service in the debugger (just using F5), provided the service is installed first (see below).
Installing and running the service
Configuration
There are two main settings that must be configured in the AmqMonitor.exe.config file:
<appSettings>
  <add key="AmqHosts" value="host1,host2,host3"/>
  <add key="SampleInterval" value="0:01:00"/>
</appSettings>
- AmqHosts is a comma-delimited list of brokers to monitor.
- SampleInterval is the interval at which to poll all the brokers. A value of 1 minute is appropriate for long-running production monitoring.
Installation
Once configured, the service is installed like so (make sure you are running an elevated command prompt). This installs the service and performance counters.
C:>AmqMonitor.exe install
13:02:27.525 Starting AmqMonitor version 1.0.0.0
13:02:27.589 Configuration Result:
[Success] Name AmqMonitor
[Success] Description Monitor service that publishes AMQ queue statistics as performance counters.
[Success] ServiceName AmqMonitor
13:02:27.591 Topshelf v3.1.122.0, .NET Framework v4.0.30319.18444

Running a transacted installation.

Beginning the Install phase of the installation.
13:02:27.604 Installing AmqMonitor service
Installing service AmqMonitor...
Service AmqMonitor has been successfully installed.
Creating EventLog source AmqMonitor in log Application...

The Install phase completed successfully, and the Commit phase is beginning.

The Commit phase completed successfully.

The transacted install has completed.
Starting and stopping
Once installed, the service will automatically start on every boot. It can be manually started and stopped from the Services control panel in Windows.
The service can also be started manually from the command line:
C:>AmqMonitor.exe start
13:04:37.086 Starting AmqMonitor version 1.0.0.0
13:04:37.150 Configuration Result:
[Success] Name AmqMonitor
[Success] Description Monitor service that publishes AMQ queue statistics as performance counters.
[Success] ServiceName AmqMonitor
13:04:37.152 Topshelf v3.1.122.0, .NET Framework v4.0.30319.18444
13:04:38.101 The AmqMonitor service was started.
…or stopped:
C:>AmqMonitor.exe stop
13:04:42.859 Starting AmqMonitor version 1.0.0.0
13:04:42.922 Configuration Result:
[Success] Name AmqMonitor
[Success] Description Monitor service that publishes AMQ queue statistics as performance counters.
[Success] ServiceName AmqMonitor
13:04:42.926 Topshelf v3.1.122.0, .NET Framework v4.0.30319.18444
13:04:43.189 The AmqMonitor service was stopped.
Logs
The service writes to a log file located at C:\Logs\AmqMonitor.log. Check this file for error information when the service is misbehaving.
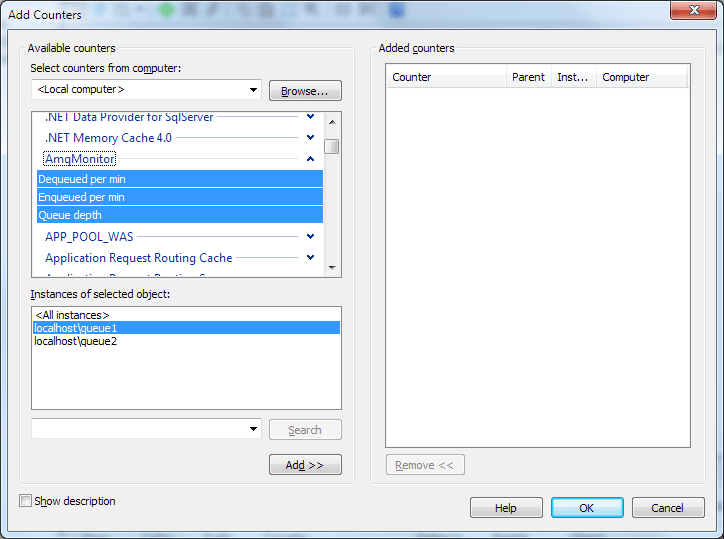
Monitoring in PerfMon
In Windows Performance Monitor, the performance counters appear under the category AmqMonitor. Each of the queues on each of the configured hosts appear as instances in the form of host\queue.
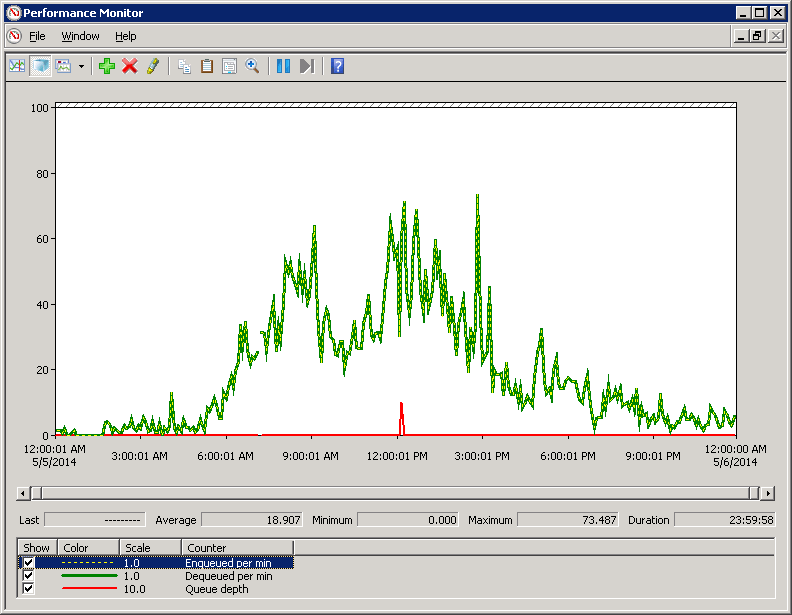
Example performance trace
Here’s an example of PerfMon counters for one of our production queues over the course of a day. We can see that the enqueue rate matches the dequeue rate throughout the day, keeping queue depth at zero. We can also see that the maximum enqueue rate is 73.4 messages per minute and the average is 18.9. This gives us important information about storage and computational requirements downstream, as well as knowledge about burst throughput that we can use for auto-scaling or capacity planning. We can also compare these traces week to week to see if a particular behavior is typical, how usage is increasing over time, and other interesting things.
Best practices
- Don’t set the AmqMonitor sample interval too small. A value of 1 minute is probably sufficient for enabling long-running performance traces in production. Less is better if you intend to monitor the counters in real time.
- Make sure the sample interval in PerfMon is greater than the sample interval configured in AmqMonitor. This prevents unnecessary duplicate PerfMon samples and also achieves a “blended rate” behavior, which can smoothe out small fluctuations in the counter values due to sample granularity. For long-running traces, a value of 5 minutes is sufficient.
- Use these performance counters in conjunction with your organization’s existing monitoring tools such as Nagios and NewRelic to enable alerts and centralized reporting.
- Compare current behavior to historical values to understand how usage is scaling over time. Use data to drive capacity planning.
- Benchmark the system during performance testing to understand its throughput limits and pinpoint potential performance problems. Compare this to production values to know what percent of capacity the system is running at. Consider scaling up the number of consumer threads or scaling out the number of consumer machines to extend system capacity when needed.
- Monitor the activemq.dlq queue. When a consumer application fails to confirm receipt of a message from a queue (e.g., if there is an error processing the message), the AMQ client library will automatically retry the message up to 6 times and then dead-letter it. Messages in the dead letter queue must be manually recovered. A high queue depth in the DLQ is typically an indicator of a problem in a downstream system. It effectively represents data loss. It also presents an operational risk because it consumes part of the broker’s configured storage capacity. If you do not regularly monitor the DLQ, an application defect can cause it to fill up and bring down the entire broker.
Download the code
Grab the code from our GitHub repo here: https://github.com/practicefusion/AmqMonitor